
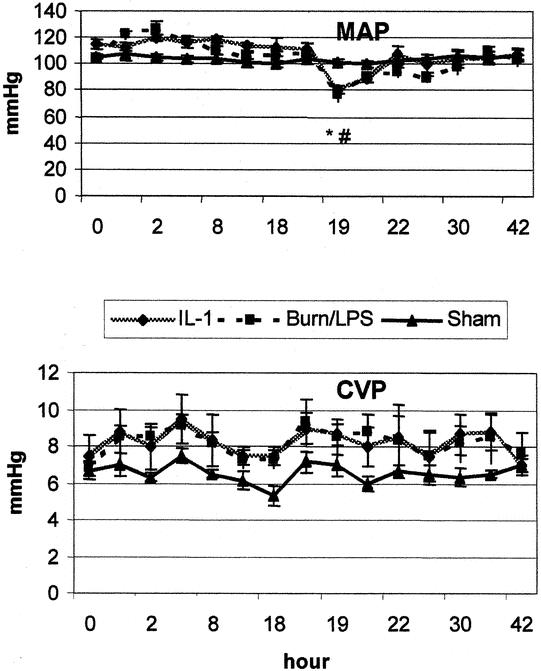
Figure 1. Mean arterial pressure (MAP) and central venous pressure (CVP) after burn (0 hour) and endotoxin (18 hours). IL-1α treatment had a marginal effect. P < .05 *vs. baseline, #vs. sham, ¥vs. IL-1α.
Official websites use .gov
A
.gov website belongs to an official
government organization in the United States.
Secure .gov websites use HTTPS
A lock (
) or https:// means you've safely
connected to the .gov website. Share sensitive
information only on official, secure websites.
Figure 1. Mean arterial pressure (MAP) and central venous pressure (CVP) after burn (0 hour) and endotoxin (18 hours). IL-1α treatment had a marginal effect. P < .05 *vs. baseline, #vs. sham, ¥vs. IL-1α.