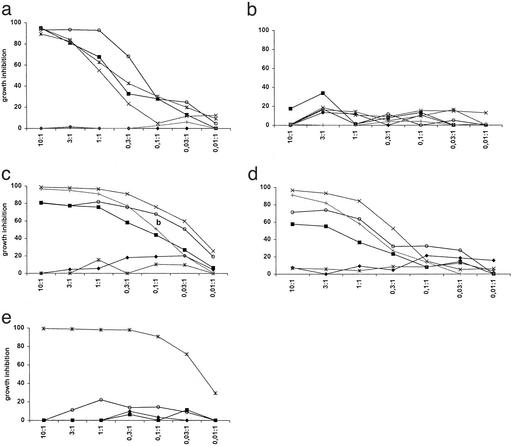
Figure 5.
Percentage of growth inhibition by different CTL clones in the HPC growth-inhibition assay. Effector cells: (a) high-affinity anti-HA-1 CTL clone; (b) intermediate affinity anti-HA-1 CTL clone; (c and d) high-affinity anti-HA-2 CTL clones; (e) control anti-HLA-A1/HY CTL clone. Target cells: ♦, donor HPCs; ■, recipient CML HPCs before transplantation; ○, recipient CML HPCs at relapse; x, unrelated CML patient X; *, unrelated CML patient Y; +, unrelated CML patient Z. On the x axis the E/T ratio is shown. Tissue typing: CML-X ♀, HLA-A2, HA-1-positive, HA-2-positive; CML-Y ♂, HLA-A1, -A2, HA-1-positive, HA-2-negative; and CML-Z ♂, HLA-A2, HA-1-negative, HA-2-positive.

