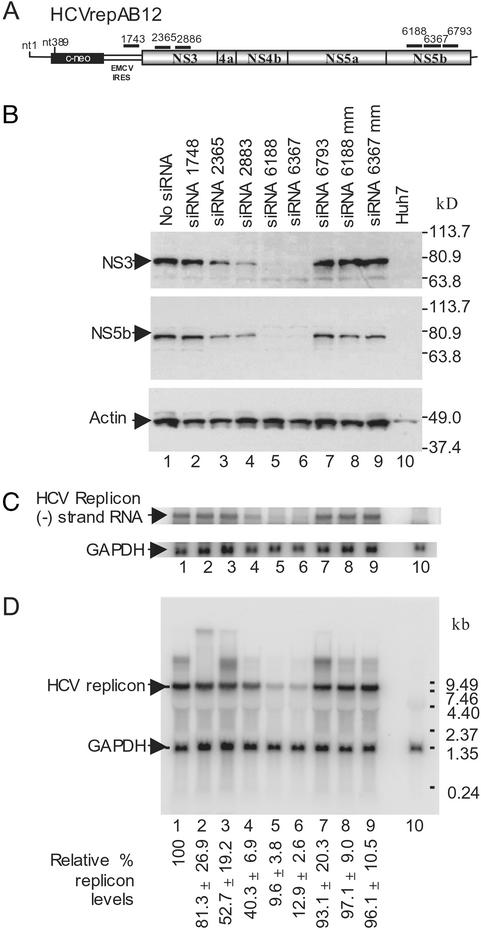
Figure 1.
Synthetic siRNA directed inhibition of HCV replicon in Huh-7 cells. (A) Schematic diagram of the HCVrepAB12neo replicon RNAs showing the approximate locations of the siRNA target sequences. EMCV, encephalomyocarditis virus; IRES, internal ribosome entry site. (B) Western blot analysis of HCV nonstructural protein levels in AB12-A2 cells 72 h after electroporation. Samples were electroporated in the absence of siRNA (lane 1, no siRNA), with 1 of 6 HCV sequence-specific siRNAs (lanes 2–6), or with a control siRNA containing mismatched nucleotides (lanes 8 and 9, siRNA 6188 mm and siRNA 6367 mm). A sample from the parental Huh-7 cells is shown (lane 10). Blots were probed with monoclonal antibodies to either NS3 (Top) or NS5b (Middle). A third blot was probed with antiactin (Bottom) to control for protein loading. Protein size markers are shown on the right side. (C) Northern blot analysis of negative-strand HCV replicon RNA levels in siRNA-treated replicon cells 48 h after induction of RNAi. RNA was purified from a portion of the samples described for B. The Northern blot was probed with 32P-labeled (−) strand-specific riboprobe to detect negative strand HCV replicon RNA and a 32P-labeled GAPDH DNA to control for RNA loading. The locations of the HCV replicon (−) strand RNA and control GAPDH RNA are indicated. (D) Northern blot analysis of HCV replicon RNA levels in AB12-A2 cells 48 h after electroporation of siRNAs. The samples analyzed by Northern blot are identical to those described for B. RNA size markers are shown on the right side, and the RNA bands corresponding to HCV replicon RNA and GAPDH mRNA are indicated on the left side. HCV replicon and GAPDH RNA levels on Northern blots were quantitated by PhosphorImager (Molecular Dynamics) analysis. The average level of HCV RNA present in each sample is given below each lane as a percentage relative to the levels seen in cells not treated with siRNA. Percent SDs are given based on the average of three independent experiments.

