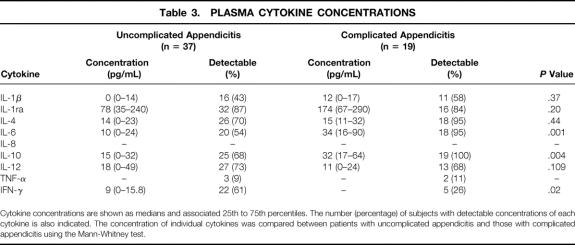
Table 3. PLASMA CYTOKINE CONCENTRATIONS
Cytokine concentrations are shown as medians and associated 25th to 75th percentiles. The number (percentage) of subjects with detectable concentrations of each cytokine is also indicated. The concentration of individual cytokines was compared between patients with uncomplicated appendicitis and those with complicated appendicitis using the Mann-Whitney test.

