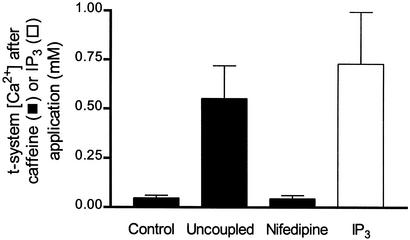
Figure 3.
[Ca2+] in the t-system 30 s after the following interventions: control fibers after SR Ca2+ depletion with caffeine and low Mg2+; “high-Ca2+ uncoupled” fibers after SR Ca2+ depletion with caffeine and low Mg2+ (see Results); and fibers preincubated in 10 μM nifedipine after SR Ca2+ depletion with caffeine and low Mg2+ in the presence of nifedipine and fibers exposed to 500 μM IP3 in a myoplasmic solution containing 1 mM Mg2+ and 200 nM Ca2+ (no caffeine). The data represent means ± SEM for three to nine cells per condition. The data points for “uncoupled” fibers are significantly different (P < 0.01) from those for controls and nifedipine (one-way ANOVA), and there is no statistically significant difference (P > 0.5) between controls and nifedipine-treated fibers. The values for IP3-treated and uncoupled fibers are significantly smaller (P < 0.05) than the initial [Ca2+] (1.5 mM) in the t-system.

