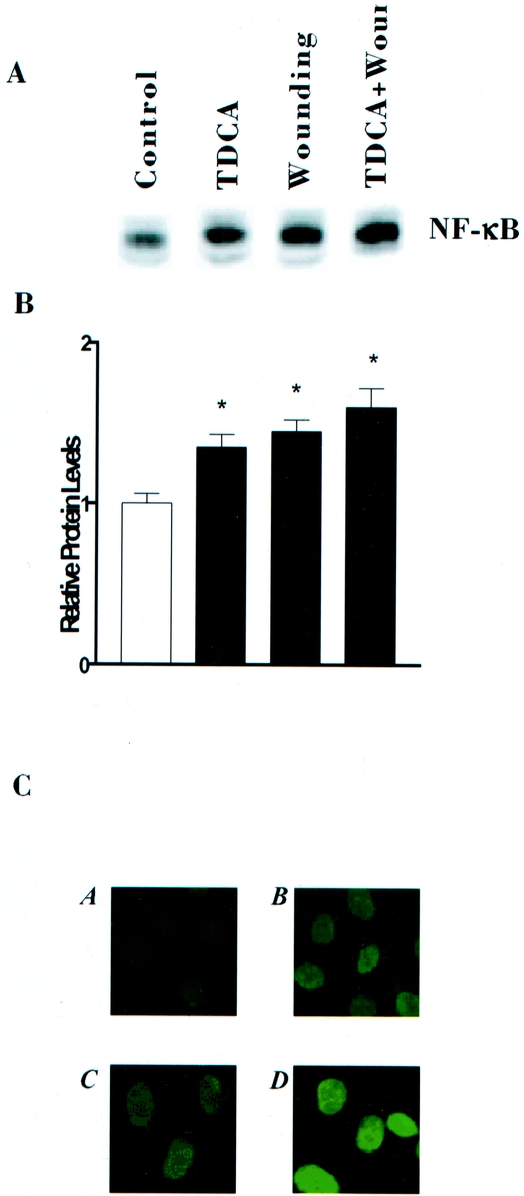
Figure 1. Levels and cellular distribution of NF-κB protein in control cells and cells treated with 0.05 mmol/L TDCA and wounding. (A) Representative autoradiograms from cells exposed to TDCA and wounding for 6 hours. Protein (10 υg) was applied to each lane and subjected to electrophoresis and Western immunoblotting. NF-κB protein was identified by probing nitrocellulose with specific antibody described in text and is indicated by NF-κB. (B) Quantitative analysis of Western blots by densitometry for cells described in (A). Relative levels of NF-κB were corrected for loading as measured by densitometry of β-actin. Blots were repeated in triplicate. P < .05 versus controls. (C) Cellular distribution of NF-κB 6 hours after treatment. Bound antibody (antip65 subunit) was visualized with a, control; b, wounding; c, 0.05 mmol/L TDCA: d, wounding and 0.05 mmol/L TDCA.
