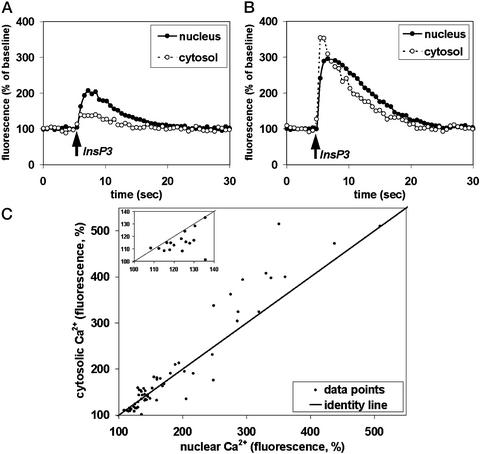
Figure 4.
Nuclear and cytosolic Ca2+ signals induced by photorelease of caged InsP3. Cells were microinjected with NPE-InsP3 plus fluo-3, then InsP3 was liberated in a controlled fashion by flash photolysis as cells were monitored by time-lapse confocal microscopy. (A) Liberation of 0.2 μM InsP3 results in a small increase in nuclear Ca2+, and an even smaller increase in cytosolic Ca2+. (B) Liberation of 9 μM InsP3 results in much greater increases in nuclear and cytosolic Ca2+, where the magnitude of the signal is greater in the cytosol than in the nucleus. (C) Summary of flash photolysis studies. Individual data points show the peak nuclear vs. cytosolic fluorescence (relative to baseline) in each of 60 observations. The identity line is shown for reference, to illustrate where data points would lie if nuclear and cytosolic fluorescence were equal. The regression curve for these data is: (% increase in cytosol) = 1.27 × (% increase in nucleus) − 39.2 (R2 = 0.92; P < 0.00001), which demonstrates that nuclear Ca2+ increases more than cytosolic Ca2+ for small Ca2+ signals, but that cytosolic Ca2+ increases more than nuclear Ca2+ for larger Ca2+ signals (main graph). Note that nuclear Ca2+ signals predominate when the Ca2+ transient is <140% of baseline (see Inset).

