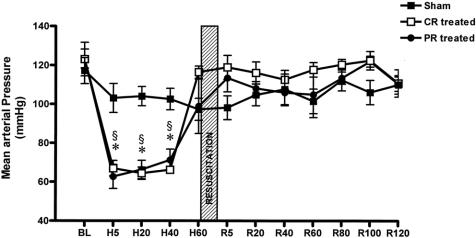
Figure 1. Mean arterial blood pressure (MAP) data. BL, baseline; H, hemorrhagic shock; R, resuscitation. CR-treated, conventional resuscitation; PR-treated, peritoneal resuscitation. Hemorrhage showed a decrease in MAP. §P < .001 vs. sham by two-way ANOVA and Tukey posttest. *P < .001 vs. baseline by repeated measures ANOVA and Dunnett posttest.

An official website of the United States government
Here's how you know
Official websites use .gov
A
.gov website belongs to an official
government organization in the United States.
Secure .gov websites use HTTPS
A lock (
) or https:// means you've safely
connected to the .gov website. Share sensitive
information only on official, secure websites.
