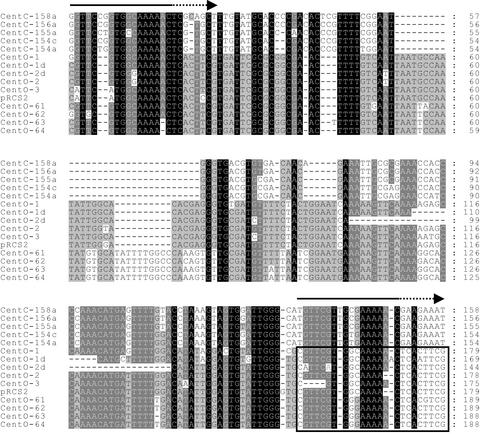
Figure 3.
Sequence Similarity between Rice CentO and Maize CentC Centromeric Satellite Repeats.
Five CentC monomers (top) are compared with CentO sequences from the 17p22 or pRCS2 clones. CentC contains an internal deletion and a degenerate duplication (CentC numbering is as in the database entry; the degenerate duplications are marked by arrows above). CentC sequences shown are from single, complete monomers, whereas CentO sequences represent single monomers followed by part (∼24 bp) of the adjacent downstream monomer (boxed). The CentO variants displayed include two partial deletions and four members of the 164-bp subfamily. The region removed in the two partial deletions has the maximum predicted potential for bending within the CentO consensus. Sequence conservation between the displayed repeats is indicated by background shading (black represents 100% conservation, dark gray represents at least 80%, and light gray represents at least 60%).

