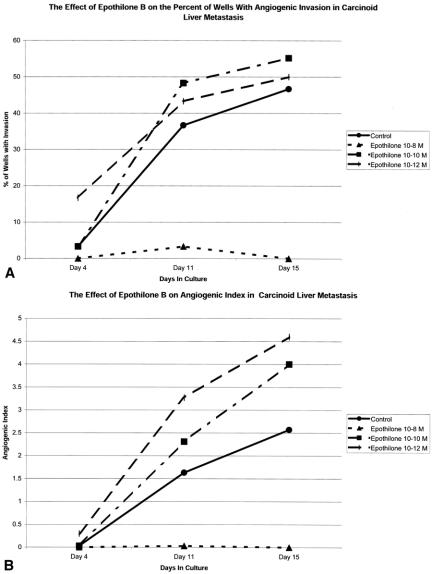
Figure 3. Time course for the development of an angiogenic response in a carcinoid liver metastasis in vitro. In this experiment, wells were exposed to Epothilone B with 10−8, 10−10, or 10−12 mol/L from day 1 in culture. Epothilone B treatment was effective at the 10−8 mol/L concentration but was ineffective at higher doses. % I, % of wells demonstrating invasion of neovessels into the fibrin-thrombin clot ([# of wells with invasion/# of wells plated] × 100). AI ± SEM, mean angiogenic index ± SEM of wells. Data from wells that demonstrated invasion into the clot and those that did not invade the clot are included. Wells that did not demonstrate invasion are represented by a score of zero.

An official website of the United States government
Here's how you know
Official websites use .gov
A
.gov website belongs to an official
government organization in the United States.
Secure .gov websites use HTTPS
A lock (
) or https:// means you've safely
connected to the .gov website. Share sensitive
information only on official, secure websites.
