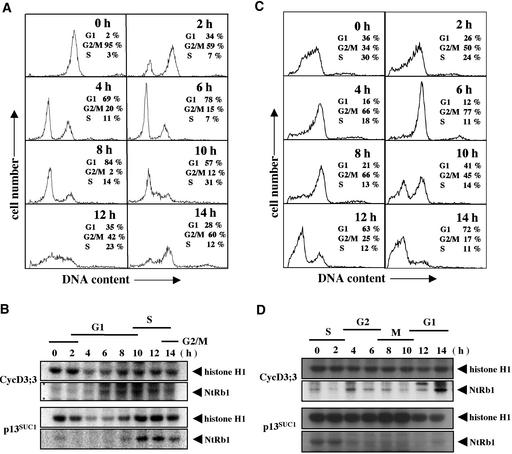
Figure 6.
Rb-Related Protein Phosphorylation Is Increased at the G1/S-Phase Transition.
(A) and (B) DNA histograms determined by LSC analysis after releasing the G2/M block imposed by treatment with both aphidicolin and propyzamide (A) and after releasing the S-phase block by treatment with aphidicolin (B). Cell cycle profiles were determined without counting the polyploid cells. The percentages of cells in G1-, S-, and G2/M-phase are shown in each panel.
(C) and (D) Anti-Nicta; CycD3;3 immunoprecipitates and the p13SUC1-bound proteins prepared from synchronized tobacco BY-2 cells were assayed for kinase activity against histone H1 and NtRb1. Labeled histone H1 and NtRb1 were resolved on denaturing polyacrylamide gels and visualized by autoradiography.

