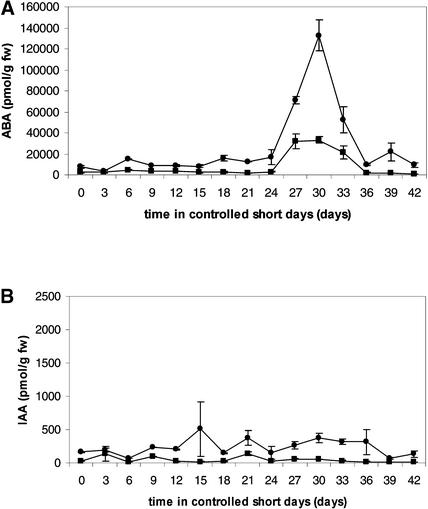
Figure 10.
Evolution of ABA (A) and IAA (B) Concentrations in the Apical Bud (Circles, Top Line) and the First Leaf Subtending the Bud (Rectangles, Bottom Line) during Short Day–Induced Bud Set.
Values given are means ± se of three individual plants. This experiment was repeated twice with similar results. Although the magnitude of ABA concentration was different, a similar increase was observed after 24 days.

