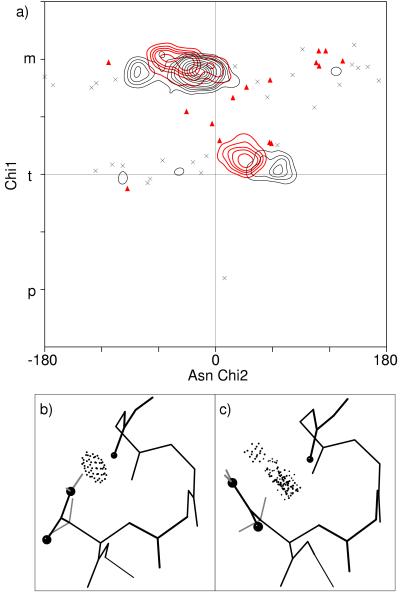
Figure 6.
(a) Plot of Asn χ1 vs. χ2 values for the 166 left-handed examples (red triangles and contours) and for the 310 strictly α-helical examples (×s and black contours). Contours representing the Gaussian smoothed distributions are shown in regions of clustering and stray points elsewhere to indicate the remaining scatter in the data. Note that χ1p is forbidden for left-handed as well as helical Asn. The two large α peaks for χ1m represent two mutually exclusive ways in which Asn interacts with residue i−4 on an α-helix. (b) Asn-99 of 1UDC with χ2 = −81°, for which Nδ forms H bonds to the i−4 backbone CO (shown by the overlapping dots). (c) Asn-12 of 1AB1 with χ2 = −21°, in which the amide makes broad van der Waals contact with the i−4 CO.

