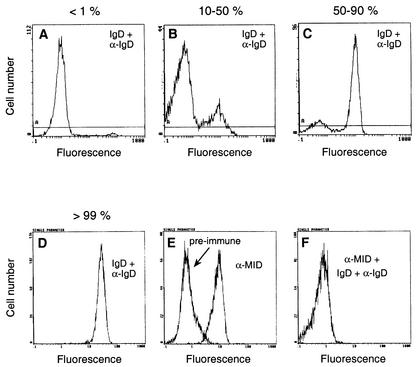
FIG. 1.
Flow cytometry profiles demonstrating four different isolates of M. catarrhalis displaying various levels of MID protein expression. (A to D) Bacterial populations with <1%, 10 to 50%, 50 to 90%, and >99% of the bacteria analyzed in high-intensity peaks are shown as representative examples. IgD binding is also shown. (E) Fluorescence with anti-MID pAb and (F) an experiment with IgD binding blocked by anti-MID pAb. Bacteria were grown to stationary phase and incubated with human myeloma IgD(κ) or rabbit anti-MID pAb (α-MID) on ice. After 1 h and washes, FITC-conjugated rabbit anti-human IgD pAb (α-IgD) or swine anti-rabbit pAb was added for an additional 30 min, followed by additional washes and subsequent flow cytometry analysis. In panel E, “pre-immune” indicates fluorescence of bacteria incubated with a rabbit preimmune serum and then with the FITC-conjugated swine anti-rabbit pAb.

