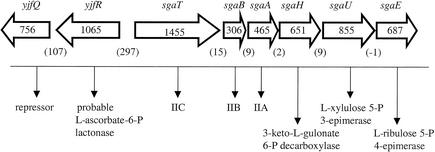
FIG. 1.
The E. coli sga operon showing the gene names (above the genes, indicated by arrows) and gene lengths (number of base pairs within the arrows). The arrows, with lengths proportional to gene size, indicate the direction of transcription. The (putative) functions of the gene products are indicated below the arrows. The numbers in parentheses indicate the numbers of base pairs in the intergenic regions.

