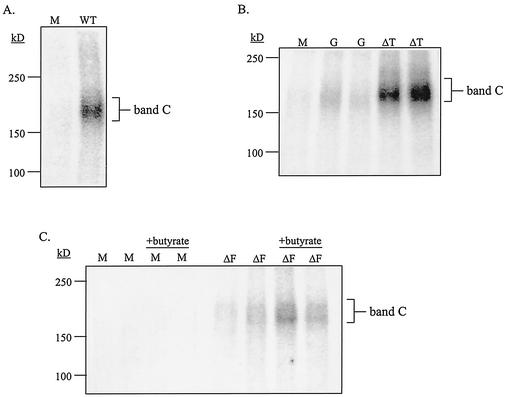
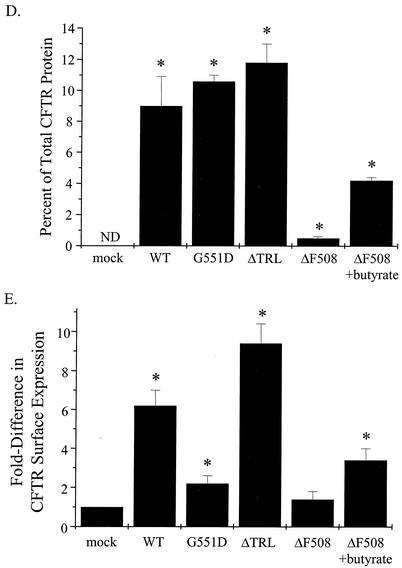
FIG. 6.
Analysis of surface expression of WT and mutant CFTR proteins. IB3-1 cells were cotransfected with constructs encoding β-galactosidase and mock control (M) or WT-CFTR (A), G551D-CFTR or ΔTRL-CFTR (B), or ΔF508-CFTR (C) as described in the Fig. 4 legend. Cells transfected with the ΔF508-CFTR construct were treated with and without sodium butyrate (5 mM) for 18 h at 37°C. Cells were analyzed for CFTR cell surface expression at 48 h posttransfection by a two-step cell surface periodate-long-chain hydrazide biotinylation procedure as described previously (24). Band C, the mature, fully glycosylated form of CFTR, is indicated; representative blots of biotinylated CFTR proteins are shown. (D) Percentage of CFTR at the cell surface versus total CFTR expressed under steady-state conditions (n = 3 to 5; *, P ≤ 0.05 relative to mock control; ND, none detected). (E) Fold difference in CFTR cell surface expression between WT- and mutant CFTR-expressing cells (n = 3 to 5; *, P ≤ 0.05 relative to mock control).


