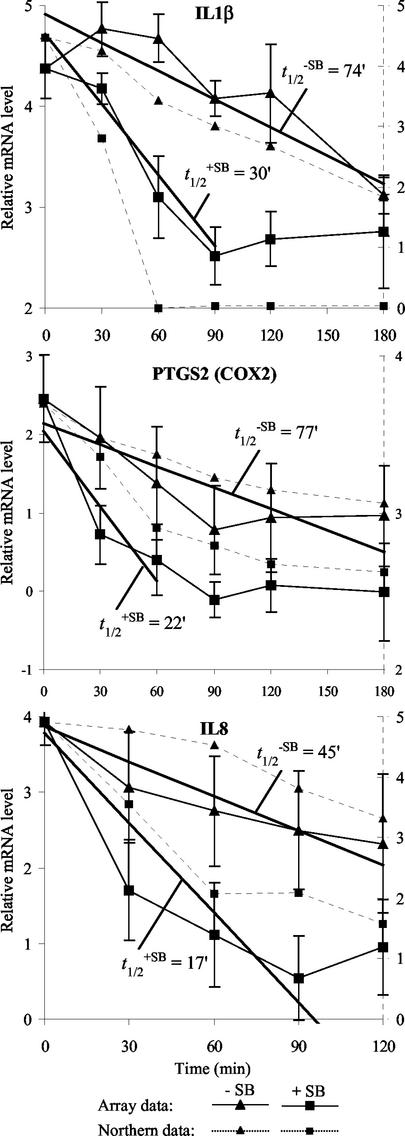
FIG. 4.
p38-dependent differential mRNA decay of interleukin-1β (IL1β), COX2, and interleukin-8 (IL8): correlation of cDNA array and Northern blot data. Shown here are the graphs of array (solid lines) and Northern (dotted lines) data for interleukin-1β, COX2, and interleukin-8 mRNA decay. The array data are averages of log-transformed normalized ratios of treated over untreated samples from three repeats with standard deviations (solid y axis). The linear regression through the time points used in the half-life (t1/2) calculation is shown as a bold line with the respective t1/2 indicated (in minutes) (see text for details). The Northern data are glyceraldehyde-3-phosphate dehydrogenase-normalized, log-transformed signal intensities determined by densitometry from the Northern blots shown in Fig. 3 (dotted y axis).

