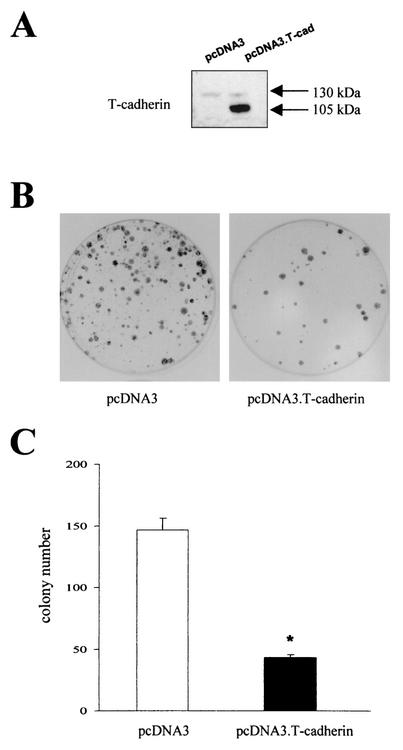
FIG. 2.
Transfection of T-cadherin into C6 glioma cells results in growth suppression. (A) Western blot demonstrates overexpression of the mature (105-kDa) and uncleaved precursor (130-kDa) forms of T-cadherin in C6 cells transfected with pcDNA3.T-cadherin compared to those transfected with pcDNA3 vector. (B) Equimolar amounts of pcDNA3.T-cadherin and pcDNA3 were transfected into C6 cells. Representative plates are shown after 14 days of selection and quantitated in panel C. (C) The single asterisk denotes a statistically significant decrease in colony number in each of the three dishes transfected with pcDNA3. T-cadherin compared to those transfected with pcDNA3 vector (P < 0.01). Error bars, SDs.

