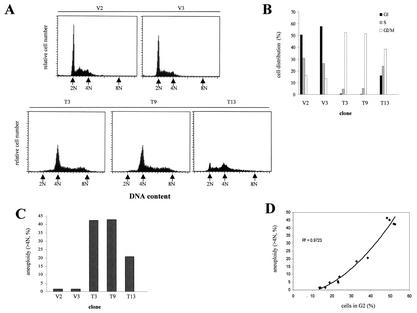
FIG. 6.
Cell cycle analysis demonstrates a dramatic increase in the percentage of T-cadherin-overexpressing cells in G2/M phase. (A) The T-cadherin-overexpressing clones T3, T9, and T13 and the vector-transfected clones V2 and V3 were synchronized by serum starvation for 48 h, and DNA content was measured by flow cytometry at 12 h after serum stimulation. The arrows depict the positions of 2N (G1), 4N (G2/M), and 8N. T3 and T9 showed aneuploid DNA histogram patterns, whereas V2 and V3 did not. (B) The cell distribution in G1, S, and G2/M phases is graphically represented for vector-transfected and T-cadherin-expressing C6 clones. T-cadherin-expressing clones T3 and T9 exhibit a high percentage of cells in G2/M phase and a decreased percentage of cells in G1 phase compared to the V2 and V3 clones. The T13 clone shows a slightly increased percentage of cells in G2/M phase and a modestly decreased percentage of cells in G1 phase. (C) T-cadherin-expressing C6 clones demonstrate increased numbers of aneuploid cells (>4N) compared to vector-transfected clones V2 and V3. (D) The proportion of the aneuploid cells directly correlates with the percentage of cells in G2 (R2 = 0.9723).

