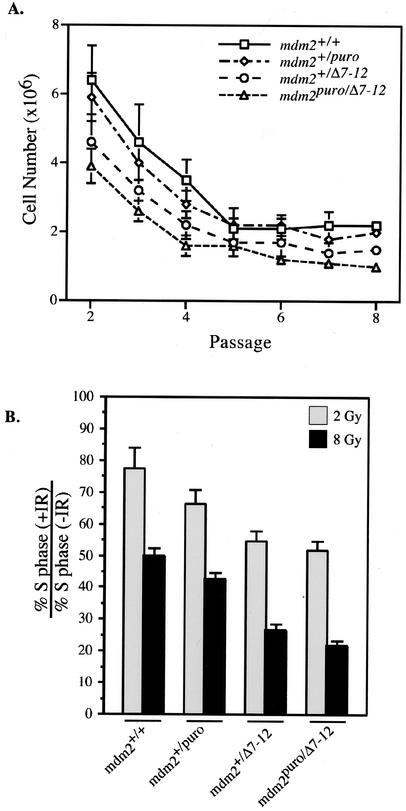
FIG. 6.
Proliferative capacity of MEFs from mice of various mdm2 genotypes. (A) Growth curves for MEFs of the indicated genotypes. MEFs were seeded in triplicate at an initial density of 106 cells per plate and counted every 3 days, after which they were replated at the original density. Graphed is the average number of cells per plate at each passage. Consistent results were obtained for independently derived MEFs. (B) Ratio of the percentage of cells in S phase 16 h following treatment with 2 or 8 Gy of ionizing radiation (+IR) to the percentage in S phase in the absence of treatment (−IR). Bromodeoxyuridine incorporation was used to determine the S-phase fraction.

