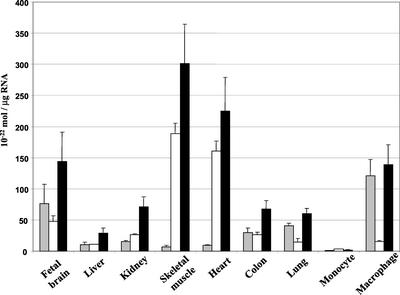
Figure 2.
Real-time PCR analysis of tissue expression of the ORP1 variants. The mRNA source tissues are indicated below the bars. The level of ORP1L and ORP1S expression is indicated with gray and white bars, respectively. Black bars show the level of ORP1 expression determined with primers that detect both variants. The data has been normalized using the total amount of RNA in each sample. Data are given as mean ± SD (n = 2).

