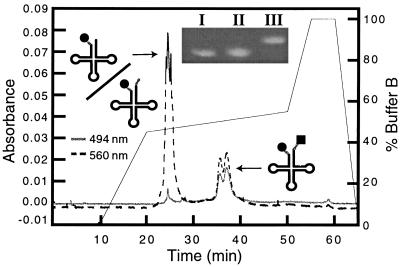
Figure 1.
HPLC trace showing separation of TMR–tRNA–FL from TMR–tRNA. TMR and FL are represented by a circle and square, respectively. Following a 10-min wash with buffer A, the elution profile was developed by increasing the percentage of buffer B as follows: 0 → 50% over 10 min, 50 → 55% over 30 min, and 55 → 100% over 5 min (Inset) Denaturing PAGE gel (8%) analysis of fluorescently labeled tRNALys-3. One microgram each of tRNA–FL (lane I), TMR–tRNA (lane II), and TMR–tRNA-FL (lane III) was denatured by heating at 85°C in 66% formamide for 2 min, followed by cooling on ice water for 2 min. RNA samples were visualized by ethidium bromide staining.

