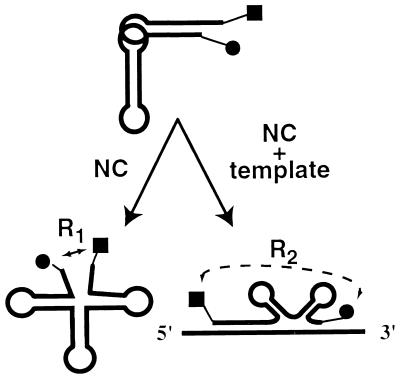
Figure 2.
Transfer RNA unwinding and annealing monitored by FRET. Schematic illustration of tRNA structural changes probed in this work. R1 and R2 represent the distance between the probes on NCp15 addition in the absence (Lower Left) and presence (Lower Right) of template. TMR and FL are represented by a circle and square, respectively.

