Figure 1.
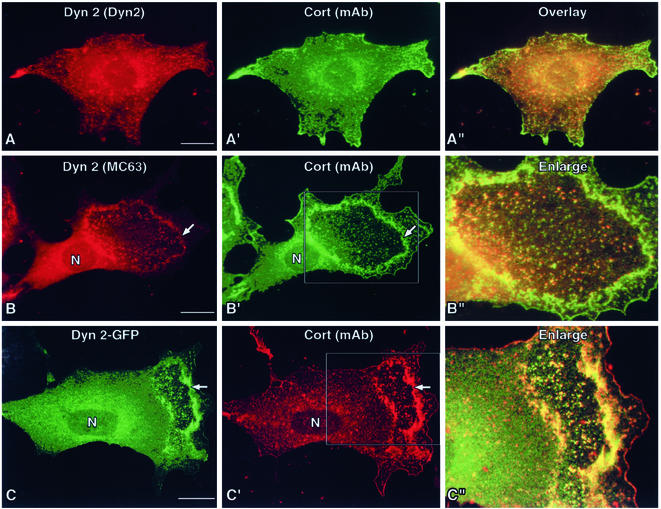
PDGF treatment induces the formation of Dyn2-cortactin–rich membrane waves. Immunofluorescence microscopy of NIH/3T3 cells, either resting or stimulated with 30 ng/ml PDGF-bb for 5 min and dual labeled with reagents to Dyn2 and cortactin. (A–A") In resting cells, both proteins associate modestly within the cell cortex and on internal membrane structures and cells show a flattened nonpolarized morphology. (B, B′ and C, C′) In contrast, cells exposed to PDGF show dramatic changes in shape and in the distribution of Dyn2 and cortactin proteins. Cell staining with multiple antibody reagents and GFP-tagged proteins show Dyn2 and cortactin seem to coassemble into punctate spots that coalesce into wave-like rings (arrows) marking the leading edge. (B" and C") Higher magnification images of the waves show substantial overlap of Dyn2 and cortactin in the puncta of the wave structures. Bars, 10 μm.

