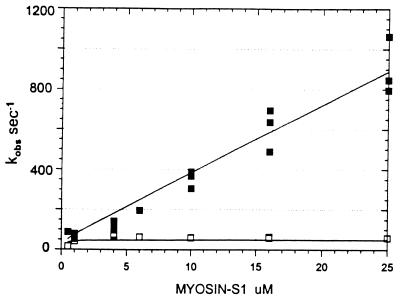
Figure 2.
Dependence of the observed rate constants on S1 concentration. The solid squares are for the step associated with the lag and the open squares for the fluorescence change step. Observed rate constants were obtained from three data sets similar to those described in Fig. 1. The theoretical lines through the data are from the mechanism shown in Eq. 2.

