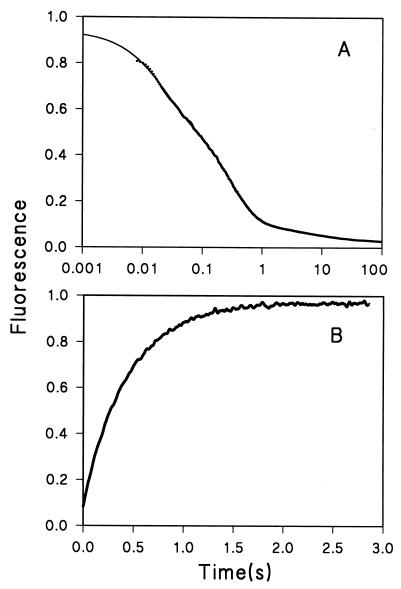
Figure 2.
Kinetic traces of refolding and unfolding. The unit of fluorescence is arbitrary. (A) Refolding at 1.0 M GdmCl. A three-exponential fitting yields a residual signal that is 1/70 that of the total amplitude. The apparent relaxation rate constants are λ1 = 50 sec−1, λ2 = 3.5 sec−1, and λ3 = 0.1 sec−1. The solid line is the fitting curve. (B) Unfolding at 3.0 M GdmCl. The data fitted with a single exponential have a residual 1/20 that of the total amplitude. The solid line is the fitting curve.

