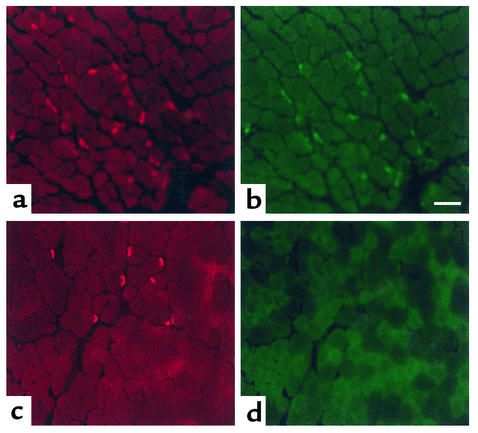
Figure 4.
Diaphragm muscles from the Daf1–/– (a and b) and Daf1+/+ (c and d) mice 48 hours after injection with McAb-3 mAb. αBTX stain demonstrates the endplate regions (a and c). Double-labeling with FITC-labeled anti-C3 Ab (1:3,000 dilution) demonstrates C3 deposition at almost all junctions from the Daf1–/– animal (b), while no complement deposition is observed in junctions of muscles from the Daf1+/+ animal. Scale bar = 100 μm.

