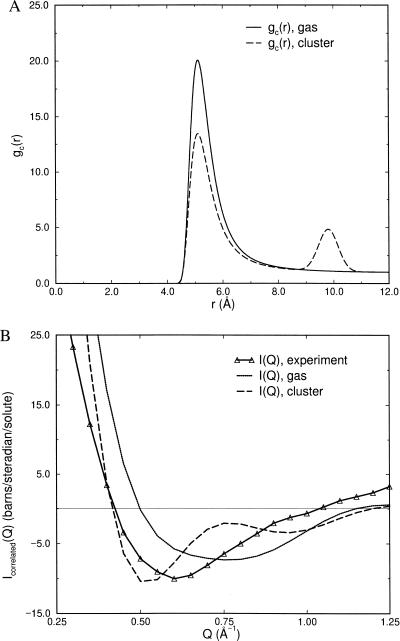
Figure 2.
(A) Model gc(r)’s describing gas and cluster forms of NALA correlations in solution. The gas phase gc(r) corresponds to a Lennard-Jones interaction between solute molecules represented as spheres of σ = 5.0 Å with ɛ = 1.6 kcal/mol. The cluster gc(r) is the same as the gas phase except for a second peak position at 2σ. (B) A comparison of the excess experimental signal with the simulated solute–solute scattering derived from the various models of gc(r) shown in A. The comparison emphasizes that the gas and cluster forms of gc(r) are probably not viable representations of the solute–solute correlations.

