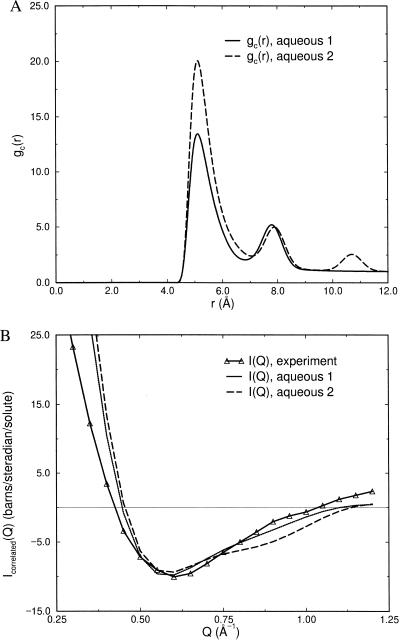
Figure 3.
(A) Model gc(r)’s describing aqueous forms of NALA correlations in solution. The aqueous model of gc(r) is the same as the gas but has peak positions at dsolute + dwater, where d represents the diameter of a water molecule, and a second aqueous form with an additional peak at dsolute+ 2dwater. (B) A comparison of the excess experimental signal with the simulated solute–solute scattering derived from the various models of gc(r) shown in A. The aqueous forms are clearly in good agreement with the excess experimental signal, but the data is inconclusive as to how far apart the solutes are positively correlated in solution.

