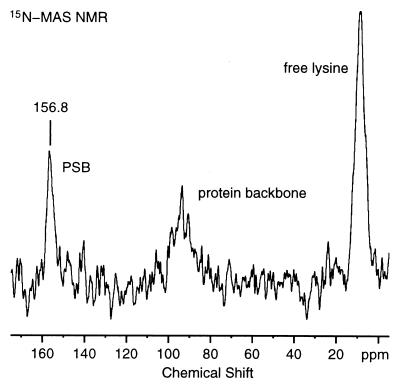
Figure 4.
15N MAS spectrum of 6.5 mg of 2-13C-glycine, 6-15N-lysine rhodopsin in DOPC membranes. The 15N PSB resonance is observed at 156.8 ppm. The 15N signals corresponding to the free lysines and natural backbone of the protein are observed at 8.7 and 93.6 ppm, respectively. The spectrum shown corresponds to 122,880 acquisitions. The 15N chemical shifts are reported relative to external 5.6 M aqueous 15NH4Cl. The spectrum was processed with 20 Hz of exponential line broadening.

