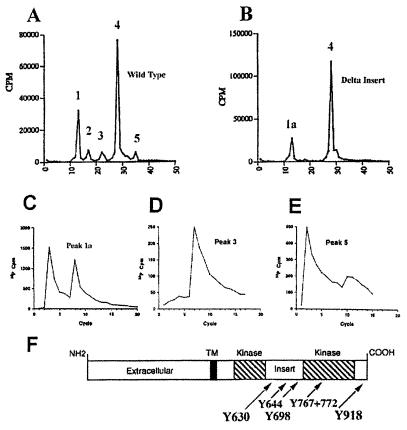
Figure 1.
Identification of Tor autophosphorylation sites. (A and B) In vitro phosphorylated TorWT and TorDelta-Insert were separated by reverse phase HPLC, and fractions were collected. The relative amount of 32P radioactivity in each fraction is shown. Peaks 1 + 1a (C), peak 3 (D), and peak 5 (E) were subjected to sequencing. A summary of the phosphotyrosine analysis is shown in F.

