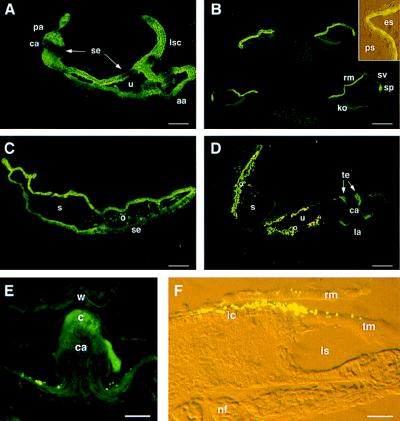
Figure 4.
Distribution of otoconin-95 in the developing inner ear. (A) Section through the three ampullae and part of the utriculo-saccular complex at E14.5. (B) Four sections of the cochlear duct at P0. Note that cochlear cell differentiation proceeds with a base-to-apex gradient of maturation. (Inset) A detailed view of the two cell layers of the Reissner’s membrane. (C) Saccule at P0. (D) Vestibule at P4. (E) Posterior ampulla at P21. The punctate signals above the epithelium on each side of the cristae were not reproducible; they may correspond to displaced utricular otoconia. (F) Cochlea at P8. Inset and F micrographs were taken under both daylight and fluorescent light with Nomarski optics. The 046CP4 serum was used at 1:1,000 dilution. aa, anterior ampulla; c, cupula; ca, crista ampullaris; es, endolymphatic space; ic, interdental cells; is, inner sulcus; ko, Kölliker’s organ; la, lateral ampulla; lsc, lateral semicircular canal; nf, nerve fiber; o, otoconia; pa, posterior ampulla; ps, perilymphatic space; rm, Reissner’s membrane; s, saccule; se, sensory epithelium; sp, spiral prominence; sv, stria vascularis; te, transitory epithelium; tm, tectorial membrane; u, utricle; w, wall of the ampulla. (Scale bars: A, B, and D, 50 μm; C and E, 30 μm; F, 15 μm.)

