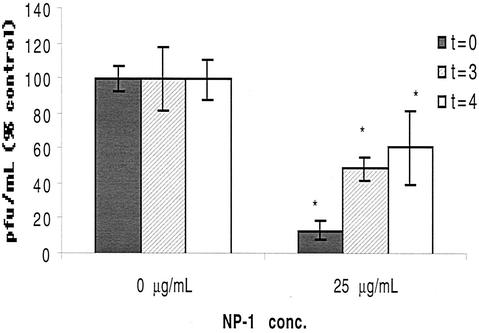
FIG. 2.
Antiviral activity of NP-1 added at different times during viral infection. Cells were cooled to 4°C and inoculated with HSV-2(G) in the presence of control buffer or NP-1 added at different times as described in Materials and Methods. Shown are the means of two experiments, each performed in triplicate; error bars indicate standard deviations. Results are presented as PFU formed in the presence of NP-1 as a percentage of PFU formed in control wells. At each time point, the effects of NP-1 were compared to those of control medium by using the Mann-Whitney test; asterisks indicate a significant reduction in viral infection (P < 0.004).

