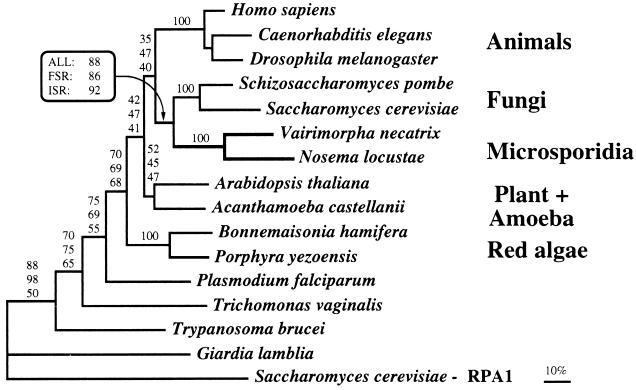
Figure 1.
Phylogenetic analyses of RPB1. Effects on bootstrap support of ISR or FSR were considered by using protein ML. The tree shown is the ML consensus tree topology from analysis of 760 aligned positions for 15 RPB1 sequences and 1 outgroup RPA1 sequence. Values report bootstrap support from ML analyses for all 760 sites (ALL sites), 669 sites (FSR, where the fastest evolving sites common to the ML tree and a tree where Microsporidia are at the base of the eukaryotes were removed), and 645 sites (ISR). Where only a single bootstrap value is shown, support was 100% in all analyses. The scale bar represents 10% estimated sequence divergence under the JTT-F model.

