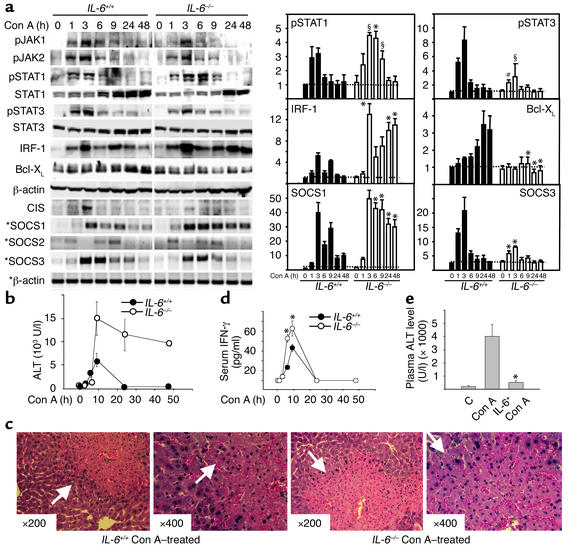
Figure 5.
STAT3 and SOCS3 activation are attenuated, but liver injury, STAT1, IRF-1, and SOCS1 activation are enhanced in Con A–induced hepatitis in IL-6–/– mice. (a) IL-6+/+ mice and IL-6–/– mice were injected with 10 μg/g of Con A. At various time points, liver protein extracts and RNA were analyzed by Western blot or RT-PCR (indicated by asterisks), respectively, using Ab’s and primers as indicated (left panel), and quantified by PhosphorImager analysis (right panel). The values are shown as means ± SEM from four independent experiments. *P < 0.001, #P < 0.01, §P < 0.05 vs. corresponding control groups at the same time point. (b) Serum ALT levels from these mice were measured. Values are shown as means ± SEM from four mice at each time point. (c) Photomicrographs of representative mouse livers obtained 9 hours after Con A injection with H&E staining are shown (original magnification ×200 and ×400). White arrows indicate massive necrosis observed in the liver. (d) Wild-type control and IL-6–/– mice were injected with Con A (10 μg/g). At various time points, serum IFN-γ levels were measured. Values are shown as means ± SEM from three mice at each time point. *P < 0.001 vs. corresponding Con A-treated wild-type control groups at the same time points. (e) C57BL/6J mice were injected (intravenously) with IL-6 (2 μg/g), followed 6 hours later by injection of Con A (10 μg/g). After 8 hours, serum ALT levels were measured. Values shown are means ± SEM from five mice. Significant difference from corresponding Con A–treated group is indicated by asterisks. *P < 0.01.

