Figure 6.
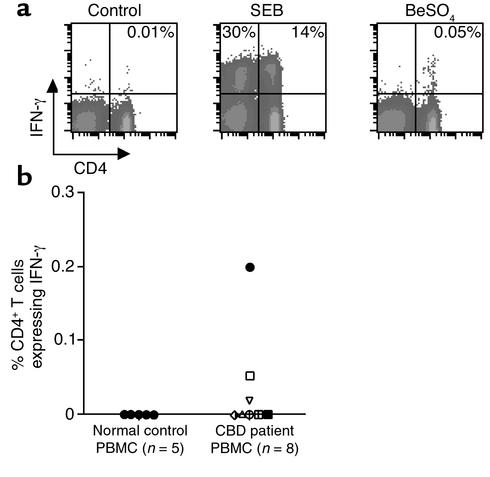
Intracellular expression of IFN-γ in peripheral blood CD4+ T cells after stimulation with SEB or BeSO4. (a) A representative experiment is shown for a flow cytometric analysis of PBMCs from CBD patient 2 stimulated with medium alone, SEB, or BeSO4 and stained for surface CD4 and intracellular IFN-γ expression. The number in the upper right quadrant of each density plot represents the percentage of CD4+ T cells expressing IFN-γ. (b) The percentage of peripheral blood CD4+ T cells that express IFN-γ after stimulation with BeSO4 is shown for eight CBD patients and five healthy control subjects. The symbols for each CBD patient correspond to those shown in Figure 4.

