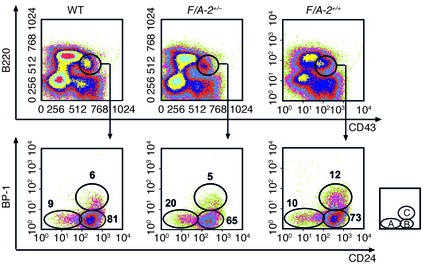
Figure 8.
Flow cytometric analysis of bone marrow B-lineage cells of 3-week-old wild-type, F/A-2+/– and F/A-2+/+ mice. B220-positive, CD43-positive lymphocytes contained within the black windows of the upper panels were analyzed for the expression of BP-1 and CD24 (lower panels). The relative size of the indicated subpopulations in the lower panels is shown as a fraction of cells in the B-lineage cell window that is shown in the upper panels. The small square schematically shows the analyzed subpopulations: A, pre-pro-B cells; B, early pro–B cells; C, late pro–B cells.

