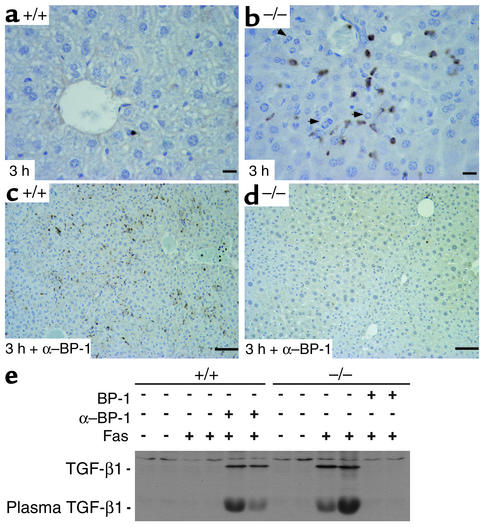
Figure 7.
Activation of TGF-β1 in IGFBP-1–/– livers after Fas agonist treatment, inhibited by IGFBP-1 treatment. (a–d) Immunohistochemical staining of liver sections using anti–TGF-β1 Ab: IGFBP-1+/+ (a), IGFBP-1–/– (b), IGFBP-1+/+ pretreated with anti–IGFBP-1 Ab (c), and IGFBP-1–/– pretreated with IGFBP-1 (d) 3 hours after Fas treatment. Scale bars: 10 μm (a and b) and 50 μm (c and d). Arrowheads indicate apoptotic hepatocytes. (e) Western analysis showing TGF-β1 activation in IGFBP-1+/+ livers pretreated with anti–IGFBP-1 Ab and in IGFBP-1–/– livers 7 hours after Fas challenge, but not in IGFBP-1–/– livers pretreated with IGFBP-1 7 hours after Fas challenge.

