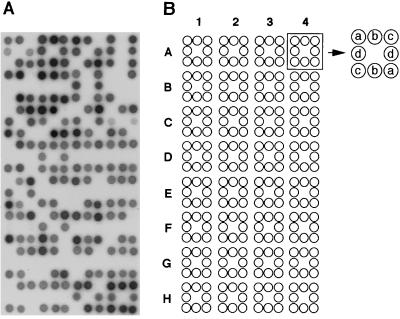
Figure 3.
Dot-blot analysis of F2 intercross rats. (A) Hybridization signals obtained with AP3-G7 probe (D2Ncc32). A total of 128 amplicons were prepared from 105 ACI × BUF F2 rats and from 23 rats of seven inbred strains by AP-PCR. The amplicons were blotted onto a 36- × 72-mm filter in duplicate arrangement, as shown in B, by using a Kriplanker. Note that each amplicon gives a clear positive or negative signal. (B) Arrangement of AP-amplicons. The 36- × 72-mm filter was divided into four columns (1–4) and eight rows (A-H), which was the same arrangement with one-third of a 96-well plate. Each 9- × 9-mm square accommodated duplicate blots of four amplicons (a, b, c, and d).

