Figure 6.
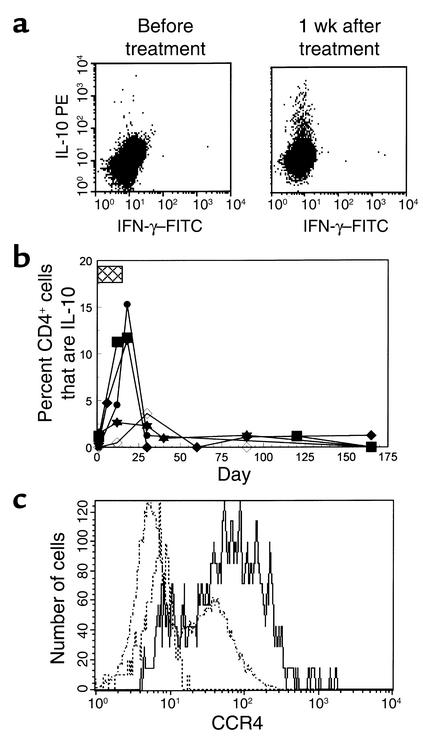
Expression of IL-10 in CD3+/– T cells after treatment with hOKT3γ1(Ala-Ala). (a) PBMCs were isolated from a patient before and 1 week after the last dose of drug. The cells were cultured for 6 hours in the presence of monensin and CD28 and then stained for CD3 on the cell surfaces and intracellular IFN-γ (x axis) and IL-10 (y axis) after permeabilization. Further studies identified the IL-10+ cells as being CD4+ (see text). (b) The presence of IL-10+CD4+ T cells was studied before, during, and after treatment with the anti-CD3 mAb. The box indicates the time that the anti-CD3 mAb was given. The data represent the percentage of CD4+ T cells that are IL-10+ over time in the five of six patients in whom these cells were identified. (c) The IL-10+CD4+ T cells express CCR4 on their surfaces. The histogram shows surface staining with CCR4 on IL-10+CD4+ (solid line), IL-10–CD4+ (dashed line), or background staining on CD4+ cells with an isotype control Ab (dotted line).

