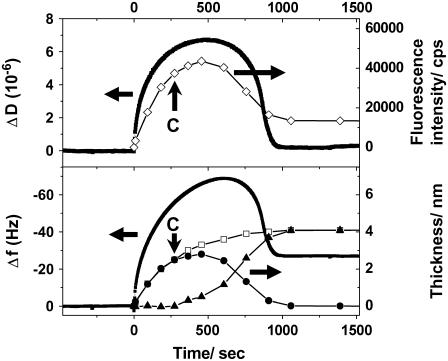
FIGURE 7.
Kinetic measurements by SPR-SPFS and QCM-D for the vesicle fusion of POPC/POPS (4:1): The dissipation (ΔD) and frequency shift (Δf) measured by QCM-D were plotted versus vesicle incubation time, together with the fluorescence intensity (SPFS: upper frame) and the lipid bilayer thickness (SPR: lower frame), respectively. The estimated amounts of adsorbed vesicle and planar bilayer (same as in Fig. 6) are also given for comparison with the QCM-D data. The arrows with a sign “C” indicate the critical point at which rupture of vesicles started (determined from the plot in Fig. 5).

