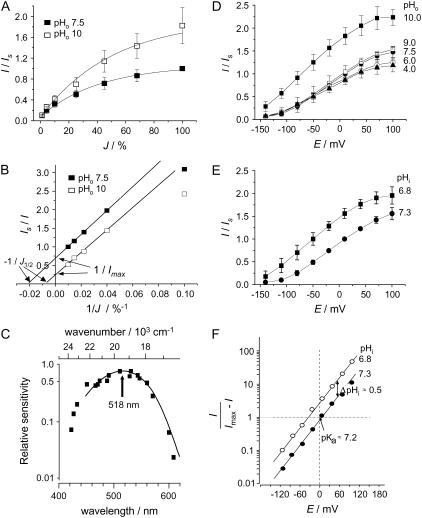
FIGURE 2.
Light- and pH-sensitivity of steady-state photocurrents. (A) Typical light/response relationship, recorded with 500-nm light at +40 mV, pHo 7.5 (control) and pHo 10. Standard current, IS = 67.7 ± 9.3 nA (n = 8) at pHo 7.5. and 100% J. (B) Same data as in A in double-reciprocal plot. (C) Action spectrum constructed from light/response relationships (reciprocal half-saturation intensities), recorded at different wavelengths. (D) Effect of pHo on steady-state I/E relationships in 100% light; data normalized to standard photocurrent, IS = 61.6 ± 7.8 nA (n = 15) at 0 mV and pHo 7.5. After each measurement, cells were exposed to the reference medium to avoid pHi changes. (E) Effect of pHi on steady-state I/E relationships in 100% light; data normalized to IS as in Fig. 2 D. (F) Same data as in panel E, replotted as log(I/(Imax − I)); linear relationship equivalent to Hill plot in ordinary enzyme kinetics; difference between pHi 6.8 and pHi 7.3: parallel vertical shift by half a log unit per ΔpHi = 0.5; pHi-insensitive slope: ≈0.6 log units (factor 100.6 = 4) per 60 mV.

