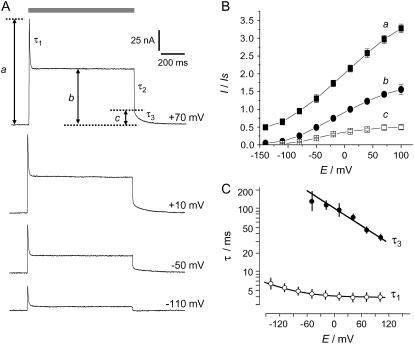
FIGURE 3.
Voltage sensitivity of amplitudes and time constants of photocurrents. (A) Four individual current traces recorded at different voltages at pHo 7.5. (B) Amplitudes of a (instantaneous current), b (steady-state current), and c (slowly decaying current component after light-off) plotted versus voltage. Means ± SE from seven cells, normalized to b at 0 mV, and reference pH conditions (pHi 7.3, pHo 7.5); (C) τ1 and τ3 plotted logarithmically versus voltage; note rather constant Q = τ3c ≈ 10 nAs over a wide voltage range, i.e., (in nAs): 6.8 at −70 mV, 8.8 at −40 mV, 11 at −10 mV, 12 at 20 mV, 12 at 50 mV, and 8.9 at 80 mV.

