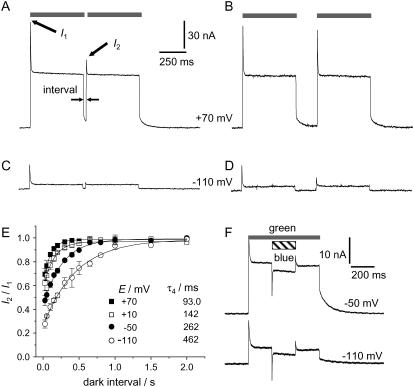
FIGURE 5.
Kinetic recovery after illumination. (A–D) Example records of exposure to a second light pulse after a reference light pulse (100% intensity) and dark periods of various durations, recorded at +70 mV and −110 mV as marked. (E) Systematic evaluation of experiments like A–D: Exponential recovery (means ± SE, n = 4) of response b–a (s. Fig. 4 A) during dark period with τ4, faster at positive and slower at negative voltage; compare Fig. 3 C, and notice τ4 > τ3. (F) Effect of blue-light (∼1022 photons m−2 s−1, 500 nm, generated by blue-light laser) on standard, green-light induced steady-state photocurrents (100% J, pHo 7.5), at −50 and −110 mV; blue-light-on: fast negative transient followed by continuous reduction of positive steady-state current; blue-light-off: qualitatively symmetric response with fast, positive transient, followed by steady-state level; note: the blue-light response is independent of the voltage.

