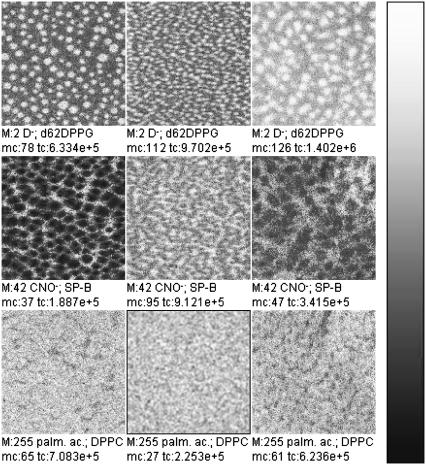
FIGURE 9.
TOF-SIMS mass-resolved images of negatively charged secondary ions of the system DPPC/d62DPPG/SP-B (80:20:0.4 mol %) after LB-transfer at 30 mN/m (left) and at 50 mN/m (middle) as well as after LS-transfer at 50 mN/m (right). The fragment ions with the mass/charge ratio of 2 (D−, d62DPPG-specific), 42 (CNO−, protein-specific), and 255 (palmitidic acid anion, DPPC-specific) are shown. Ion intensities are represented by a grayscale (see shaded bar), with dark colors representing low intensities and bright colors representing high intensities. For each image, white is set to the intensity in the brightest pixel (normalization). This intensity is referenced after “mc.” The legend “tc” refers to the total number of detected secondary ions in the respective image.

