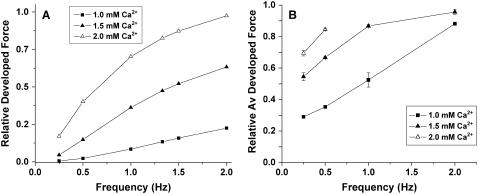
FIGURE 3.
Force-frequency relations. Developed force simulated by the ECME model (A) and measured in experiments on rat ventricular trabeculae (B) as a function of the pacing frequency at various extracellular Ca2+ levels. The simulations were run for 1500 s from the initial condition indicated in Table 16. The parameters used are as described in Tables 1–15 except for the extracellular Ca2+ concentration, which is indicated in the legend. The developed force was calculated after the model reached a pseudo-steady state from the difference between the maximum and the minimum forces during a contraction. The experiment data point shown for 1.5 mM Ca2+ at 0.25 Hz corresponded to a developed tension of 45 mN mm−2.

