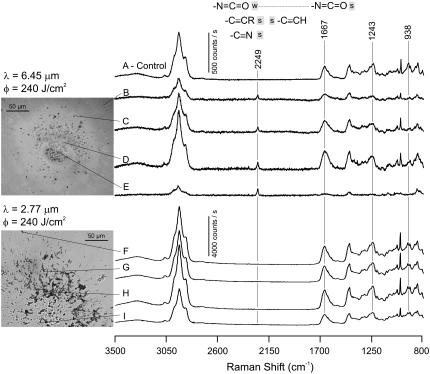
FIGURE 2.
Micro-Raman spectra of the debris collected during laser ablation of cornea. Each spectrum was collected from a single dried droplet of debris on a CaF2 window. The droplet corresponding to each spectrum is marked with a thin pointer line. A spectrum from an unexposed cornea is shown for comparison. Frequency ranges characteristic of isocyanate, nitrile, and alkyne groups are marked with the gray bars.

