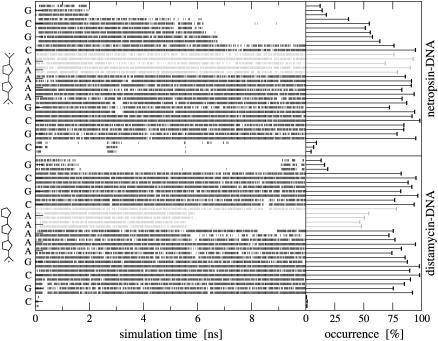
FIGURE 2.
Watson-Crick hydrogen bonds along the sequence of the primary DNA strand in netropsin-DNA (upper panel) and distamycin-DNA (lower panel). Time series of their occurrence and the corresponding cumulative values are displayed based on 10-ns MD simulations. Hydrogen bonds close to tail 2 of netropsin and distamycin (schematically represented) are in gray. Hydrogen bonds are defined to have a maximum hydrogen–acceptor distance of 0.25 nm and a minimum donor-hydrogen-acceptor angle of 135°.

