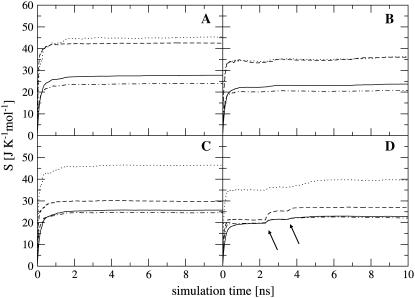
FIGURE 6.
Internal entropy per atom calculated for nonhydrogen atoms of the entire ligand molecules ( solid line), and of the subgroups tail 1 (
 (t1), dotted line), tail 2 (
 (t2), dashed line), and body (
 dot-dashed line) for netropsin free in solution (A) and when bound to DNA (B), and for distamycin free in solution (C) and when bound to DNA (D). The arrows point to the first and second rapid increases in entropy for distamycin (compare to Fig. 3).

