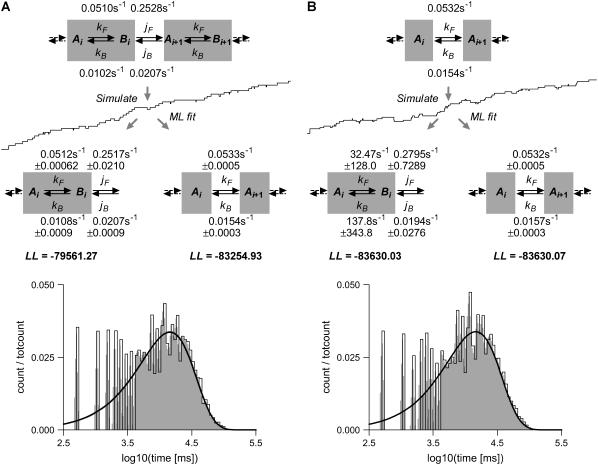
FIGURE 4.
Maximum likelihood can select the correct model. Staircase data were simulated with the two-state model shown in panel A, or with the single-state model shown in panel B, sampled at dt = 0.5 s. For each simulation model, the true rate constants are given, calculated as kij = nij/Ti, where nij is the actual number of transitions i→j, and Ti is the actual time spent in state i, as randomly chosen by the simulation routine. Each simulation was then maximum likelihood-fit with either model. The PDF curves for the ML estimates are shown overlapped on the dwell-time histograms, without correction for missed events. In panel A, the log-likelihood LL is significantly greater for the correct model, even considering the additional two free parameters, while the PDF lines overlap almost perfectly. In panel B, the two models have virtually identical LL and PDF. Notice that estimates obtained with the correct model are very accurate. In panel B, estimates obtained with the wrong model have a very large standard deviation. Notice how, due to missed events, the histogram appears to be slightly shifted to the right relative to the ideal PDF curve.

